Introduction
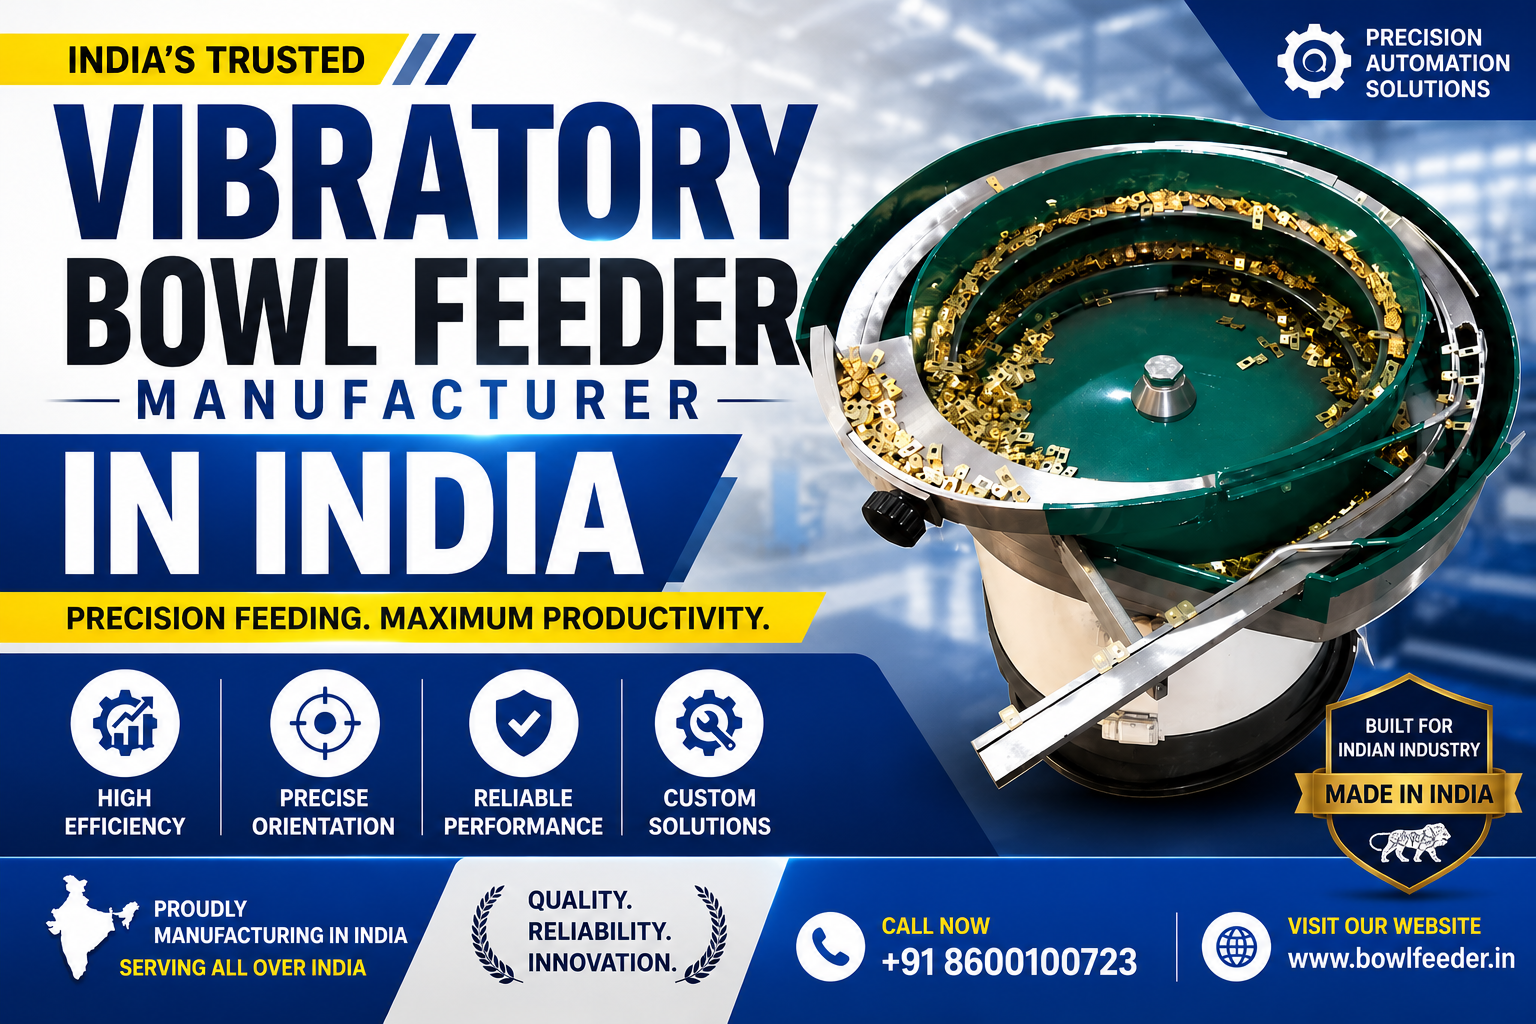
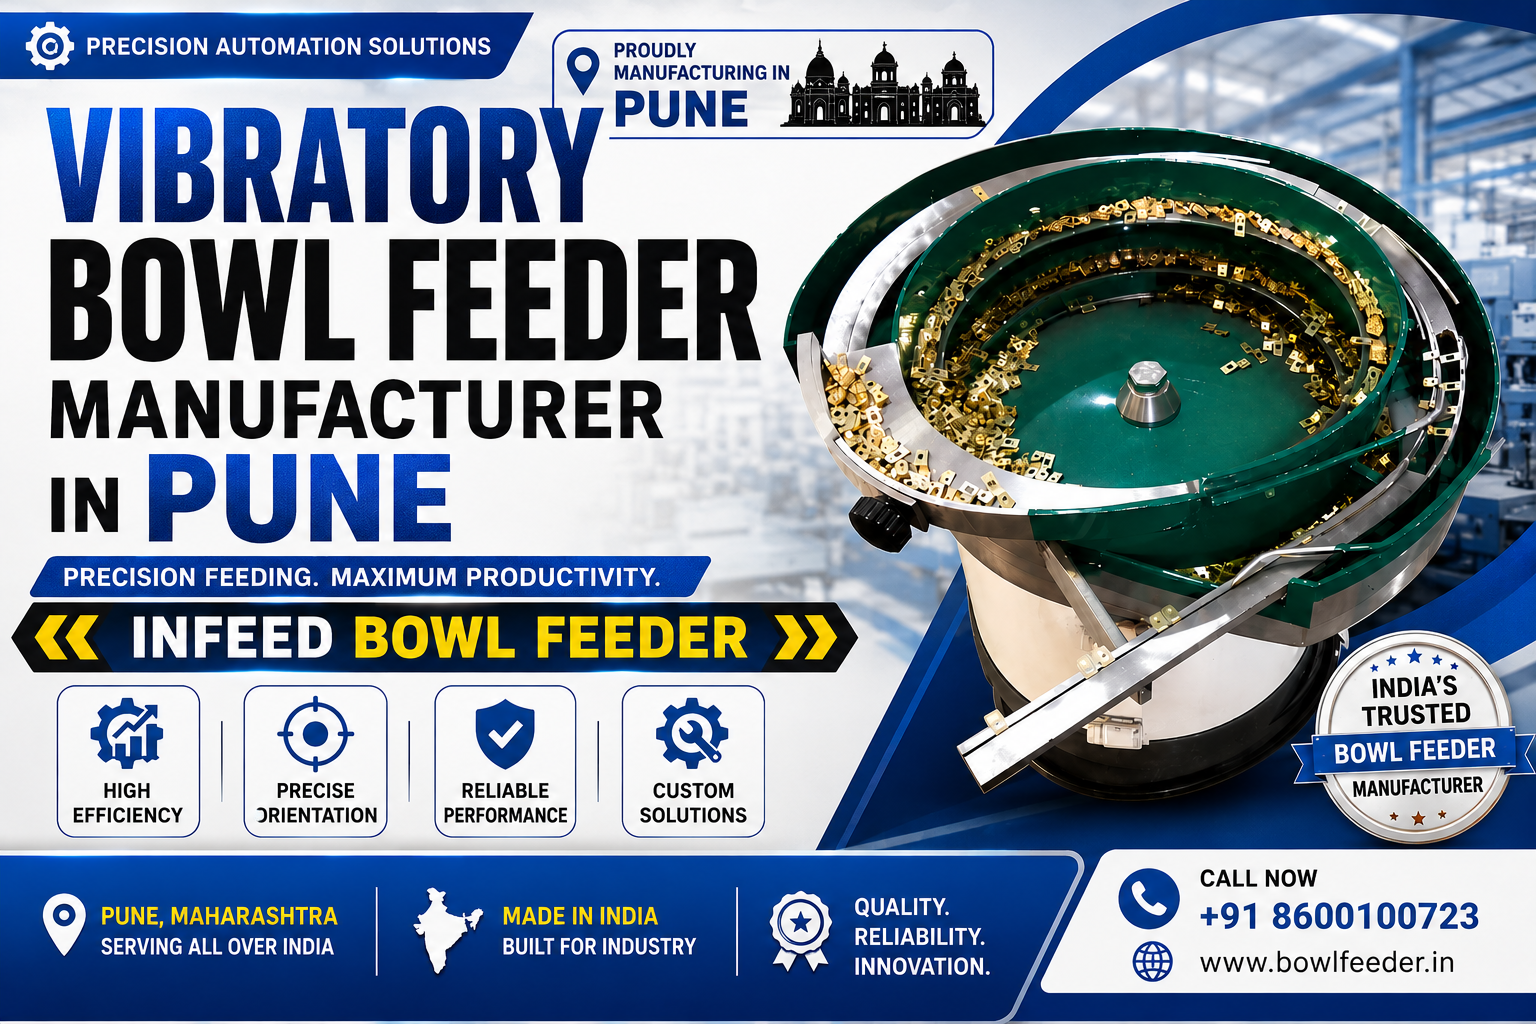
For small and medium-sized manufacturers, automation investments often feel like a financial leap. One of the most practical entry points into manufacturing automation is the bowl feeder—a simple yet powerful solution that can transform your production line.
India’s No. 1
Bowl Feeder Manufacturer
But here’s the critical question: Will it actually pay for itself?
This comprehensive guide walks you through bowl feeder pricing, hidden costs, and realistic ROI projections. By the end, you’ll have a clear framework to evaluate whether bowl feeders make financial sense for your operation.
What is a Bowl Feeder?
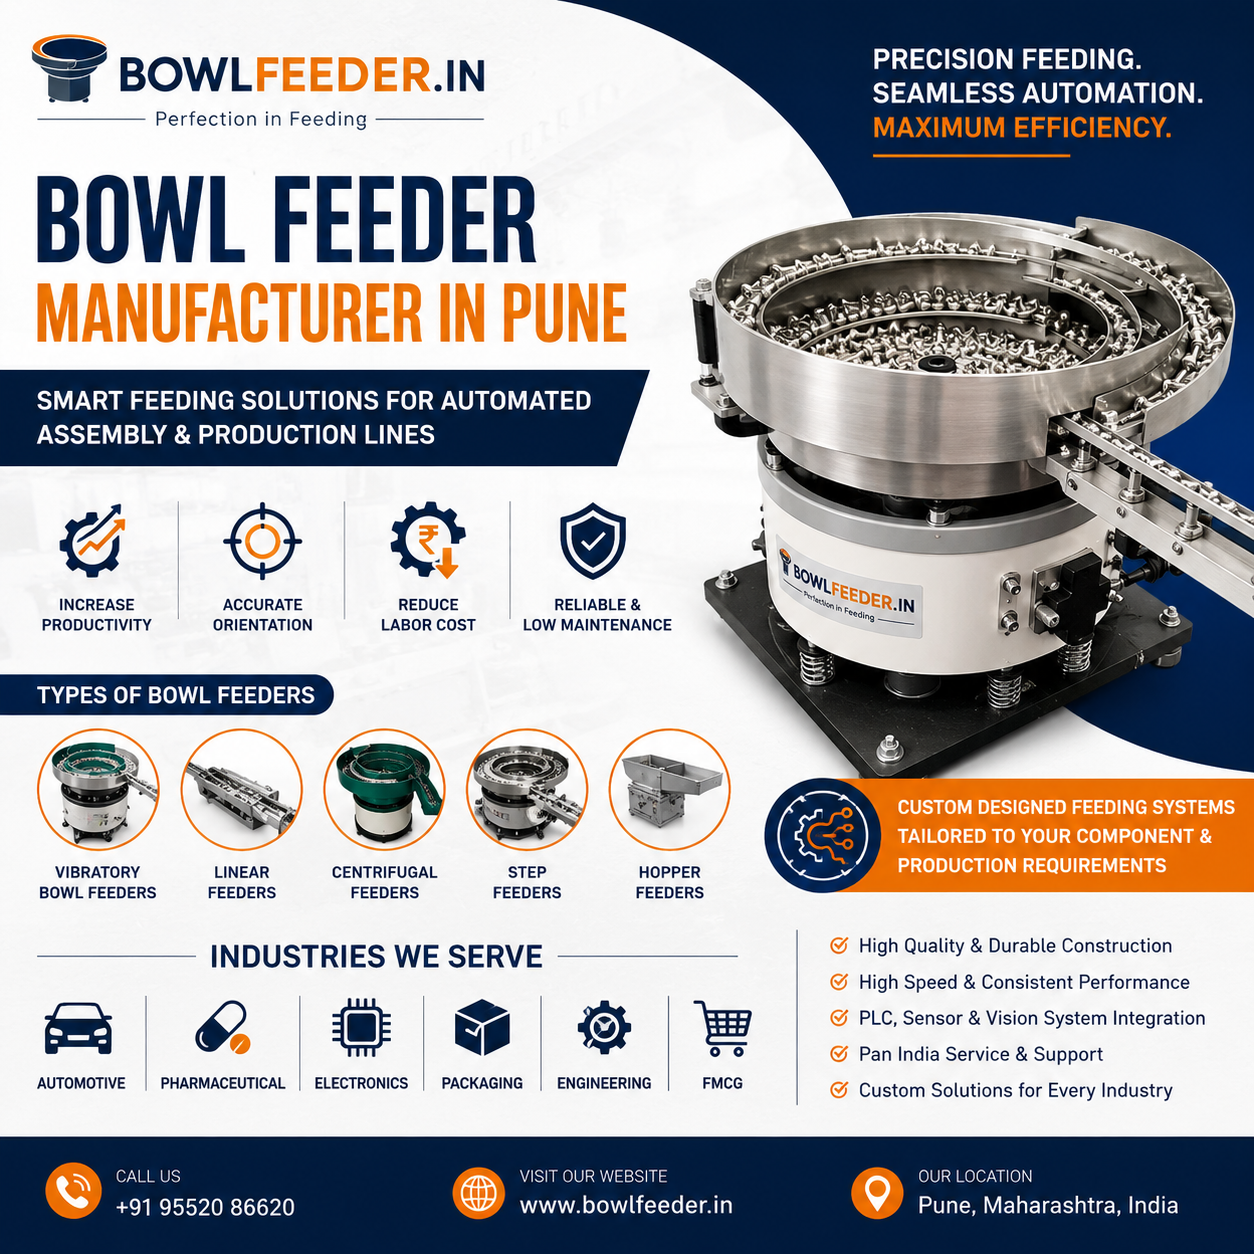
A bowl feeder (also called a vibrating bowl feeder) is an automated parts feeding system that:
- Organizes bulk parts into a single-file queue
- Orients components correctly for downstream processes
- Feeds parts automatically to assembly or processing stations
- Reduces manual handling and human error
- Operates continuously during production runs
Common Applications
- Fastener feeding (nuts, bolts, screws)
- Bearing and washer assembly
- Electroplating and coating lines
- Machining centers and CNC operations
- Packaging and cartoning systems
Why Small Manufacturers Should Care
Manual parts feeding is labor-intensive, repetitive, and prone to errors. A bowl feeder eliminates this bottleneck, allowing operators to focus on higher-value tasks.
Bowl Feeder Pricing: Complete Breakdown
Standard Bowl Feeder Costs (India Market)
The price of a bowl feeder varies dramatically based on capacity, control system, and customization:
Entry-Level Bowl Feeders
- Price Range: ₹40,000 – ₹80,000 (~$480 – $960 USD)
- Capacity: 10-20 parts per minute
- Best For: Small batch operations, hobby workshops
- Features: Basic vibration, simple controls
Mid-Range Bowl Feeders
- Price Range: ₹80,000 – ₹2,50,000 (~$960 – $3,000 USD)
- Capacity: 30-100 parts per minute
- Best For: Small to medium manufacturers
- Features: Adjustable frequency, better orientation capability, programmable timer
High-Capacity Industrial Bowl Feeders
- Price Range: ₹2,50,000 – ₹8,00,000+ (~$3,000 – $10,000+ USD)
- Capacity: 150+ parts per minute
- Best For: High-volume operations, fastener suppliers
- Features: PLC control, advanced orienting, integration-ready
What Affects Pricing?
| Factor | Impact on Cost |
|---|---|
| Bowl Diameter | Larger bowls = higher cost (₹5,000-₹20,000 difference) |
| Feed Rate | Higher PPM requirements increase expenses significantly |
| Material | Steel bowls cost more than aluminum; stainless steel is premium |
| Control System | Manual vs. PLC/automation integration can add ₹20,000-₹50,000 |
| Customization | Part-specific tooling (pushers, gates) adds ₹10,000-₹40,000 |
| Integration | Connecting to existing machinery may require engineering (₹15,000-₹50,000) |
| Warranty & Support | Extended warranties add 10-15% to the base cost |
Understanding ROI for Small Manufacturers
The ROI Formula
ROI (%) = [(Net Profit from Investment / Initial Investment) × 100]
For bowl feeders, the calculation is:
ROI = [(Annual Labor Savings + Quality Improvements – Operating Costs) / Equipment Cost] × 100
Key Variables to Track
1. Labor Savings
The primary ROI driver for bowl feeders.
- Manual Feeding Cost:
- 1 operator × 8 hours/day × 22 working days = 176 hours/month
- Average industrial labor: ₹150-₹300/hour = ₹26,400 – ₹52,800/month
- Annual labor cost: ₹3.17 – ₹6.34 lakhs
- With Bowl Feeder:
- 1 operator can manage 2-3 machines
- Operator overhead per machine: ₹1.05 – ₹2.10 lakhs/year
- Labor savings: ₹2.12 – ₹5.24 lakhs/year
2. Reduced Material Waste
- Manual feeding: 2-5% scrap rate (dropped, damaged, misaligned parts)
- Automated feeding: 0.5-1% scrap rate
- On 10,000 units/month: Saves 150-400 units × part cost = ₹15,000-₹40,000/month
3. Increased Production Capacity
- Bowl feeders improve consistency and cycle time
- Typical improvement: 20-40% production increase
- On a ₹5 lakh/month production line:
- 25% increase = ₹1.25 lakhs additional revenue/month
- At 20% profit margin = ₹25,000/month additional profit
4. Quality Improvements
- Fewer defects from consistent part orientation
- Reduced rework and customer complaints
- Better compliance documentation
- Estimated value: ₹5,000-₹15,000/month
5. Operating Costs
- Electricity: 0.5-1.5 kW × 8 hours/day = ₹300-₹900/month
- Maintenance: ₹500-₹2,000/month
- Replacement parts: ₹200-₹500/month
- Total monthly operating cost: ₹1,000-₹3,400
Real-World Case Studies
Case Study 1: Fastener Assembly Workshop (Pune)
Background:
- Small fastener assembly operation
- 3 workers feeding parts manually to the assembly line
- Production: 50,000 pieces/month
Investment:
- Mid-range bowl feeder: ₹1,50,000
- Installation & integration: ₹25,000
- Total: ₹1,75,000
Results (Year 1):
- Labor reduction: 1.5 FTE × ₹3.5 lakhs/year = ₹5.25 lakhs saved
- Scrap reduction: 3% → 0.8% = ₹18,000/month saved
- Additional capacity (15% increase): ₹2.5 lakhs additional profit
- Operating costs: -₹27,000/year
Total Annual Benefit: ₹7.98 lakhs ROI: 456% (Year 1) Payback Period: 2.6 months
Case Study 2: Bearing Manufacturer (Talegaon)
Background:
- Medium-scale bearing production
- 4 workers on parts feeding duty
- Production: 120,000 pieces/month
- Quality issues: 3% rejection rate
Investment:
- High-capacity bowl feeder (100 PPM): ₹3,50,000
- Custom tooling: ₹60,000
- Integration with existing line: ₹40,000
- Total: ₹4,50,000
Results (Year 1):
- Labor reduction: 2 FTE × ₹4 lakhs/year = ₹8 lakhs saved
- Scrap reduction: 3% → 0.5% = ₹54,000/month saved
- Production increase: 20% × ₹8 lakh/month production = ₹19.2 lakhs additional profit
- Operating costs: -₹35,000/year
Total Annual Benefit: ₹28.49 lakhs ROI: 633% (Year 1) Payback Period: 1.9 months
Case Study 3: Job Shop (Chakan MIDC)
Background:
- Diverse product manufacturing (multiple product types)
- 2 dedicated feeding operators
- Production: 30,000 units/month (mixed products)
- Frequently changing part configurations
Investment:
- Entry-level bowl feeder: ₹75,000
- Quick-change tooling: ₹20,000
- Total: ₹95,000
Results (Year 1):
- Labor savings: 0.75 FTE × ₹3.2 lakhs/year = ₹2.4 lakhs saved
- Setup time reduction: 30% improvement in changeover = ₹15,000/month saved
- Scrap reduction: 2.5% → 1% = ₹9,000/month saved
- Operating costs: -₹18,000/year
Total Annual Benefit: ₹3.21 lakhs ROI: 338% (Year 1) Payback Period: 3.5 months
Cost-Benefit Analysis Framework
Step 1: Calculate Your Current Costs
Labor Costs:
- No. of operators dedicated to feeding: ₹30,000
- Annual salary + benefits per operator: ₹45,000
- Total annual feeding cost: ₹75,000
Material Waste:
- Current scrap/rejection rate: 48%
- Average part cost: ₹35,000
- Annual production volume: 100 units
- Estimated waste cost: ₹20,000
Production Constraints:
- Current bottleneck cost (lost sales/delayed orders): ₹10,000 per month
Quality/Rework Costs:
- Current rework rate: 30%
- Cost per rework: ₹20,00
- Annual rework cost: ₹50,000
Step 2: Estimate Bowl Feeder Benefits
Realistic Savings Projections:
For your operation:
- Labor reduction: 40-60% of current feeding labor
- Scrap reduction: 50-75% improvement
- Production increase: 15-40% capacity improvement
- Quality improvement: 30-50% reduction in defects
Conservative Estimate:
- Take the lower range of each benefit
- Example: 40% labor savings = 20,000 × 0.40 = ₹8000
Optimistic Estimate:
- Take the higher range of each benefit
- Example: 60% labor savings = 40,000 × 0.60 = ₹24,000
Step 3: Calculate Payback Period
Formula: Payback Period (months) = (Equipment Cost) / (Average Monthly Savings)
Example:
- Equipment cost: ₹1,50,000
- Average monthly benefit: ₹50,000
- Payback: 1,50,000 ÷ 50,000 = 3 months
For most small manufacturers, payback periods of 2-6 months are realistic.
Step 4: Calculate 3-Year ROI
Annual Net Benefit = (Total Annual Savings) – (Operating Costs) – (Annual Maintenance)
3-Year Total = Annual Net Benefit × 3
3-Year ROI (%) = (3-Year Total / Equipment Cost) × 100
Hidden Costs & Savings You Should Know
Costs Often Overlooked
- Installation & Commissioning: ₹15,000-₹50,000
- Employee Training: ₹5,000-₹15,000
- Integration Engineering: ₹10,000-₹40,000
- Line Downtime During Installation: ₹20,000-₹100,000 (depending on volume)
- Spare Parts Inventory: ₹10,000-₹30,000 (initial stock)
- Software/Controls: ₹5,000-₹25,000 (if not included)
- Preventive Maintenance Program: ₹5,000-₹10,000/year
Total Hidden Costs: ₹70,000-₹270,000
This can increase effective payback by 1-2 months.
Savings Often Underestimated
- Reduced Supervisor Oversight: 5-10 hours/month saved
- Lower Absenteeism Impact: Operator illness doesn’t stop the line
- Reduced Material Handling Injuries: Workers’ comp savings
- Faster Order Fulfillment: Premium pricing for quick turnaround
- Reduced Working Capital: Less buffer stock needed
- Improved Customer Satisfaction: Better quality = repeat orders
- Flexibility: Can run second shift without additional labor
Additional Value: ₹2,000-₹10,000/month
Calculating Your Payback Period
Quick Calculation Tool
Step 1: Equipment Investment
- Bowl feeder base cost: ₹
- Installation/integration: ₹
- Training/setup: ₹
- Total Investment: ₹
Step 2: Monthly Savings
| Benefit | Current Cost | With Feeder | Monthly Savings |
|---|---|---|---|
| Labor | ₹ | ₹ | ₹ |
| Scrap Reduction | ₹_____ | ₹_____ | ₹_____ |
| Production Increase | ₹_____ | ₹_____ | ₹_____ |
| Quality/Rework | ₹_____ | ₹_____ | ₹_____ |
| Total Monthly Benefit | ₹_____ |
Step 3: Monthly Operating Costs
| Cost | Amount |
|---|---|
| Electricity | ₹_____ |
| Maintenance | ₹_____ |
| Spare Parts | ₹_____ |
| Total Monthly Cost | ₹_____ |
Step 4: Net Monthly Benefit = Total Monthly Benefit – Total Monthly Cost = ₹_____ – ₹_____ = ₹_____
Step 5: Payback Period = Total Investment ÷ Net Monthly Benefit = ₹_____ ÷ ₹_____ = _____ months
Interpretation:
- Less than 3 months: Excellent investment, implement immediately
- 3-6 months: Good investment, proceed with confidence
- 6-12 months: Moderate investment, acceptable for growth-focused manufacturers
- Over 12 months: Marginal, consider alternatives or scale improvements
FAQ: Bowl Feeders for Small Manufacturers
Q1: What’s the minimum production volume to justify a bowl feeder?
A: Typically, operations running 5,000+ units/month with labor-intensive feeding see positive ROI. However, even lower volumes can justify investment if:
- Manual feeding is the primary bottleneck
- Part costs are high (scrap is expensive)
- You operate multiple shifts
Q2: Can I get financing for a bowl feeder?
A: Yes. Options include:
- Equipment financing: 36-48 month terms at 9-14% interest (effectively spreading ₹1,50,000 over ₹4,000-₹5,000/month)
- MSME Subsidies: Government schemes cover 25-40% of automation equipment costs
- Lease-to-own: Pay as you generate savings
- Vendor credit: Many suppliers offer 6-12-month payment terms
Q3: How long does a bowl feeder last?
A: With proper maintenance:
- Entry-level: 3-5 years
- Mid-range: 5-8 years
- Industrial: 8-12+ years
Even if you replace it after 4 years, the cumulative ROI remains excellent (200%+ over the lifespan).
Q4: What if I have multiple product types?
A: Modern bowl feeders feature:
- Quick-change bowls and tooling
- Programmable controllers for product switching
- Tool-less orientation changes
Cost: +₹20,000-₹50,000 for flexibility, but enables:
- Reduced changeover time (30-50% faster)
- Multi-product lines sharing one feeder
Q5: Will a bowl feeder integrate with my existing equipment?
A: Most integrations are straightforward:
- Electrical: 3-phase power connection
- Mechanical: Mounting to existing frame
- Control: Simple relay logic or modern PLC integration
Integration cost: ₹ 15,000- ₹ 50,000 depending on complexity. Expect 2-5 days of installation.
Q6: What’s the typical ROI timeline for a small manufacturer?
A: Based on industry data:
| Operation Size | Payback Period | Year 1 ROI |
|---|---|---|
| Micro (5K-20K units/month) | 4-8 months | 150-250% |
| Small (20K-50K units/month) | 2-4 months | 300-500% |
| Medium (50K-150K units/month) | 1-3 months | 400-600% |
Q7: What maintenance does a bowl feeder require?
A: Minimal, but essential:
- Monthly: Visual inspection, vibration check, and clean debris
- Quarterly: Lubrication, bearing inspection
- Annual: Deep cleaning, electrical safety check, replacement of wear parts (₹2,000-₹5,000)
Preventive maintenance extends equipment life by 50%+ and prevents costly downtime.
Q8: Can I start with a small feeder and upgrade later?
A: Absolutely. This is a smart approach:
- Phase 1: Entry-level feeder (₹50,000-₹80,000) for pilot line
- Phase 2: Based on proven ROI, add a second feeder or upgrade to a higher capacity
- Phase 3: Integrate with broader automation (robotic arms, vision systems)
Phased approach reduces risk and allows ROI to fund expansion.
Conclusion: Is a Bowl Feeder Right for Your Manufacturing Business?
The data is clear: bowl feeders represent one of the highest-ROI automation investments available to small manufacturers.